Portfolio Tracking

How many browser tabs does it take to see your full picture?

Hartwell & Sons consolidates every connected broker account into one slate-professional dashboard — updated in real time, no manual reconciliation needed.

Multi-panel portfolio dashboard with P&L and asset breakdown charts

One consolidated view across all your accounts

Portfolio tracking in the Hartwell & Sons terminal pulls live position data from every connected broker account and presents it in a single, normalized view. You can slice P&L by strategy, by asset class, by time horizon, or by broker — without toggling between platforms or exporting CSVs. The slate-toned interface is deliberately low-noise: no widgets, no promotional banners, no social feeds. Just the numbers your decisions depend on, laid out in a way that makes the important ones visible without scrolling. All position data is updated on each new tick from the data feed, so what you see is current to within 100 ms of the exchange.

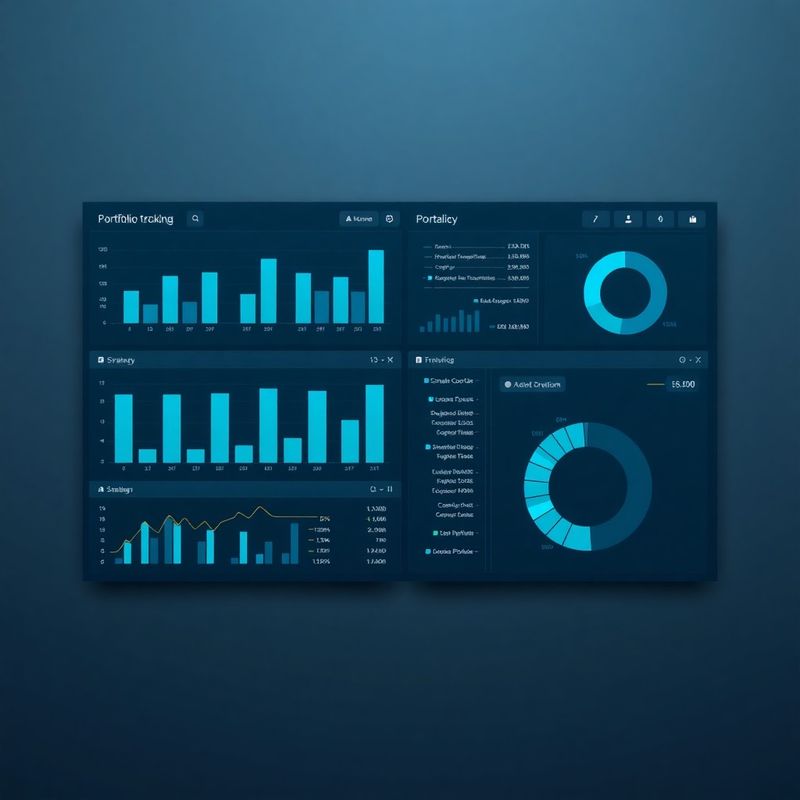
What you see on the portfolio dashboard

Views built for the way traders actually think about their book.

P&L by strategy

Each automated strategy shows its own running P&L, open exposure, and win rate since inception. When you're running multiple strategies simultaneously, you can tell at a glance which one is dragging and which one is performing as backtested.

Exposure by asset class

See your total notional exposure split by FX, equity, and ETF — both in euro terms and as a percentage of total capital. Concentration warnings appear automatically when a single asset class exceeds your configured threshold.

Performance timeline

A daily bar chart of realized P&L going back to account connection date. Filter by strategy or broker to isolate what's driving returns. Export the underlying data as a CSV for external analysis or tax documentation.

See your trading book from one place.

Connect your first broker account in minutes and the dashboard populates automatically.

Get started